
Which CX metric predicts retention? Comparing CSAT, NPS, and CES
A data-driven comparison of CSAT, NPS, and CES to determine which metric best predicts retention and where survey bias creates dangerous blind spots for CX leaders.
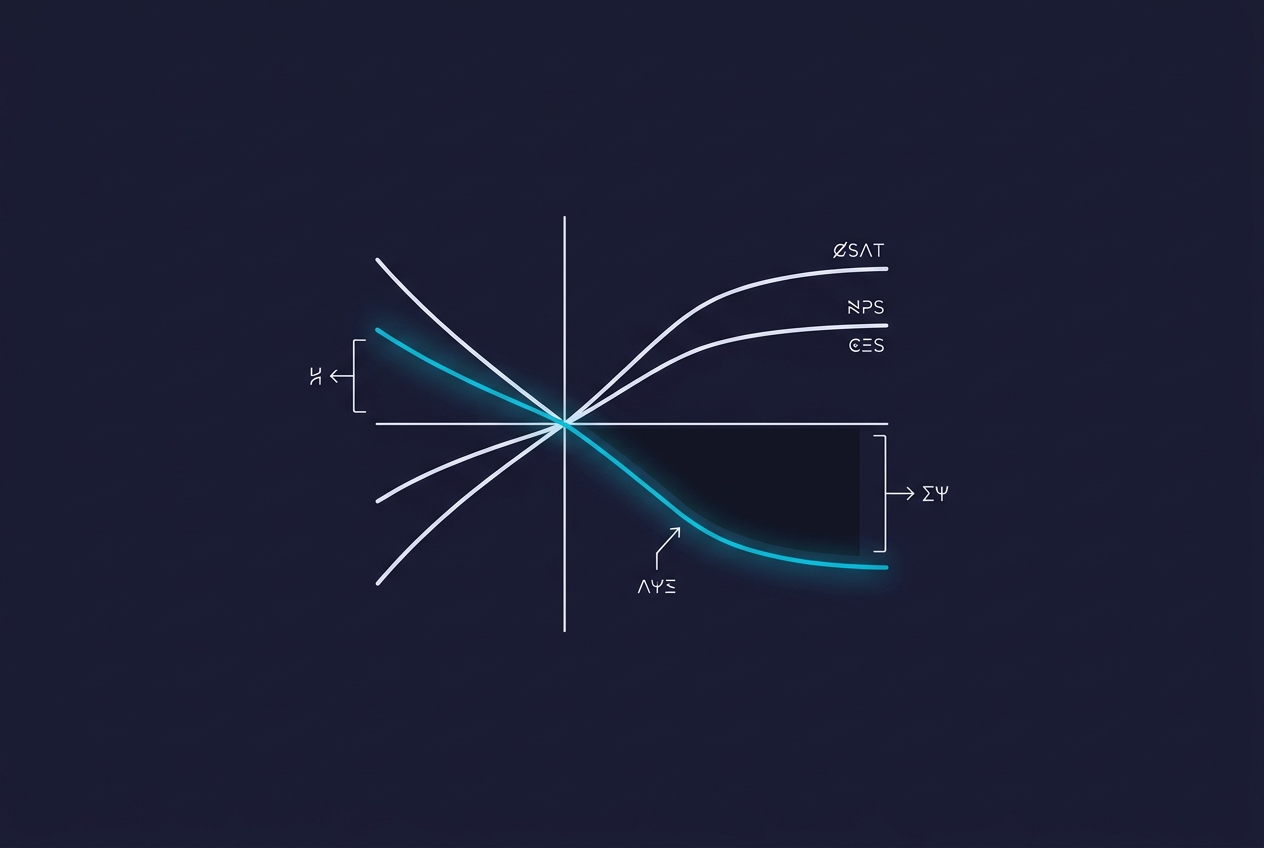
Customer Effort Score (CES) is the most reliable predictor of customer retention in service environments because it measures the specific friction that drives customers to switch brands. While Net Promoter Score (NPS) is a valuable proxy for brand sentiment and advocacy, it often fails to account for tactical service failures that lead to churn. Customer Satisfaction (CSAT) provides a snapshot of a single interaction but frequently suffers from grade inflation and does not correlate strongly with long-term loyalty.
Key takeaways
- CES tracks friction: Reducing effort is more closely tied to repeat purchase behavior than simply increasing delight.
- NPS is a lagging indicator: High advocacy scores can mask immediate churn risks if the service experience is difficult.
- CSAT is transactional: It measures the 'peak-end' of a single event rather than the cumulative health of the customer relationship.
- Survey bias is pervasive: Social desirability and recency bias often lead to inflated scores that do not match actual customer behavior.
- Behavioral data is essential: Supplementing surveys with conversation intelligence provides a more accurate view of retention risk than self-reported metrics.
Is CSAT a reliable predictor of loyalty?
Customer Satisfaction (CSAT) is the most common metric in the contact center, typically measured through a post-interaction survey. While it is effective for identifying immediate failures in a specific channel—such as a phone call handled through Genesys or a ticket in Zendesk—it is a poor predictor of whether a customer will return.
The primary reason for this is the 'Peak-End Rule,' a psychological heuristic where people judge an experience based on how they felt at its peak and its end, rather than the total sum of the experience. A customer might have spent an hour on hold, but if the agent was friendly at the end, the CSAT score might remain high. However, the initial hour of frustration still erodes the customer's long-term desire to do business with the brand. Forrester’s Customer Experience Index often notes that while emotion is a major driver of CX, transactional satisfaction scores often fail to capture the underlying effort required to resolve an issue.
Why NPS is a better brand metric than a service metric
Net Promoter Score (NPS) asks customers how likely they are to recommend a brand to others. This makes it an excellent tool for marketing and brand strategy, but it can be misleading when used to measure service performance.
The 'NPS Paradox' occurs when a customer remains a 'Promoter' because they like the product or the brand’s mission, even as they become increasingly frustrated with the service. Because NPS is often measured at a relationship level (e.g., once or twice a year), it lacks the granularity to identify specific service friction points. Furthermore, NPS is highly susceptible to cultural bias; research from firms like PwC indicates that 'experience' expectations vary wildly by region, meaning an NPS of 50 in one market may represent a completely different level of loyalty than in another.
The case for Customer Effort Score (CES) as a loyalty driver
Customer Effort Score (CES) asks a simple question: 'How easy was it to handle your request?' This metric has gained significant traction in the research community, including within the Gartner Customer Service & Support practice, because it focuses on the primary driver of disloyalty: friction.
When an interaction is difficult—requiring multiple transfers, repeated information, or high cognitive load—the customer is more likely to churn, regardless of how 'satisfied' they claim to be. CES is a leading indicator of retention because it directly measures the path of least resistance. Organizations that prioritize CES often find that reducing the effort required to get a refund or fix a technical issue has a more direct impact on retention than any 'surprise and delight' initiative. For a deeper look at operationalizing these insights, see our guide on measuring agent performance.
When the metrics lie: Understanding survey bias
Even the best-designed surveys can produce misleading data. Three specific types of bias frequently skew CX metrics:
- Social Desirability Bias: Customers often give higher scores than they truly feel because they do not want to be responsible for an agent losing their job or receiving a poor performance review.
- Non-Response Bias: The customers who are most likely to churn are often the ones who stop responding to surveys altogether. This 'silent churn' means that your CSAT and NPS scores may only reflect the opinions of your most engaged (or most angry) customers, leaving a massive data gap in the middle.
- Timing Bias: A survey sent immediately after a call might capture a different sentiment than one sent 24 hours later after the customer has had time to reflect on whether the solution actually worked.
Moving beyond surveys: Behavioral signals and conversation intelligence
To overcome the limitations of self-reported metrics, high-performing CX teams are moving toward behavioral data. Instead of asking the customer how they felt, they analyze the interaction itself.
By using platforms like Hear.ai (powers our network), teams can analyze 100% of customer conversations across channels like Five9 or Talkdesk. This provides an objective view of effort and sentiment that surveys miss. For example, conversation intelligence can identify 'unexpressed frustration'—the sighs, long pauses, or repeated questions that indicate a high-effort experience even if the customer eventually gives a high CSAT score. This data allows QA teams to move from sampling 1-2% of calls to having total coverage, ensuring that compliance and friction points are identified in real-time.
Integrating these insights into a CRM like Salesforce or Microsoft Dynamics 365 enables a more holistic view of the customer. When you can see that a customer had a high-effort interaction (behavioral data) despite a high CSAT score (survey data), you can proactively reach out to prevent churn. This multi-layered approach is essential for modern reducing customer friction strategies.
FAQ
Which metric is best for predicting churn?
Customer Effort Score (CES) is generally considered the most accurate predictor of churn in a service context. It identifies the friction points that cause customers to seek alternatives, whereas CSAT and NPS often focus on sentiment, which can be fleeting or disconnected from actual behavior.
Should I stop measuring NPS?
No, NPS remains a valuable metric for understanding brand advocacy and market positioning. However, it should not be used as the primary KPI for support teams. Use NPS for high-level strategy and CES for tactical service improvements.
How can I identify 'silent churn' if customers don't fill out surveys?
Silent churn is best identified through behavioral data, such as a sudden drop in product usage, multiple unanswered support tickets, or high-effort indicators in conversation logs. Conversation intelligence tools can flag these risks by analyzing the tone and complexity of interactions without requiring a survey response.
What is a 'good' CES score?
While benchmarks vary, the goal should be a consistent downward trend in effort. A 'good' score is one that correlates with your internal retention data. If your CES is improving but your churn rate is steady, you may be measuring the wrong friction points.
To see how these metrics translate into operational strategy, explore our guide on reducing customer friction.