
CSAT vs NPS vs CES: Which Metric Actually Predicts Retention?
Compare CSAT, NPS, and CES to identify which metric best predicts customer retention and learn why traditional surveys often fail to capture true churn risk.
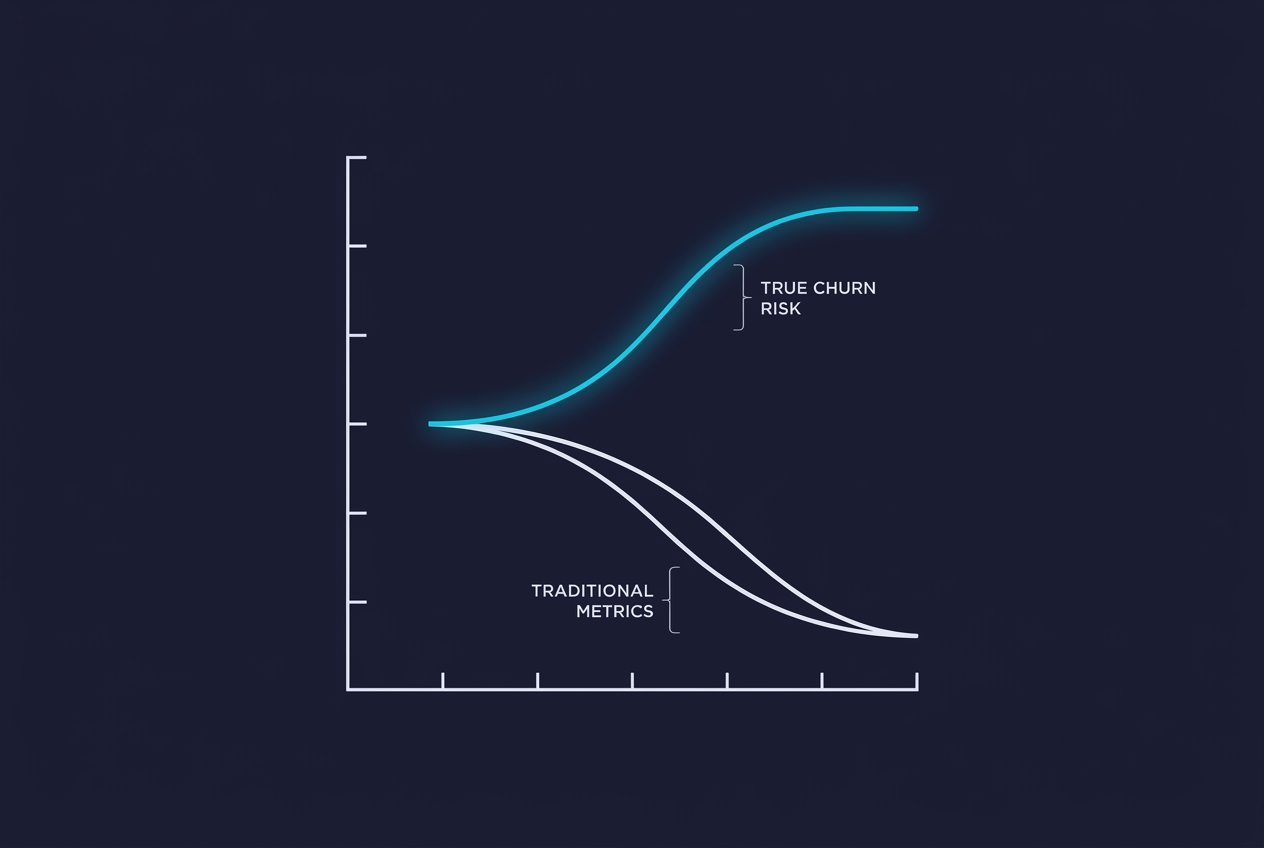
Retention is most accurately predicted by the Customer Effort Score (CES) in service contexts, while Net Promoter Score (NPS) serves as a proxy for long-term brand health. However, these metrics often provide a distorted view of reality when they suffer from selection bias—capturing only the most vocal minority while ignoring the silent churn of the indifferent majority. A robust measurement strategy requires balancing these self-reported scores with objective behavioral data to understand the true drivers of loyalty.
Key Takeaways
- CES is the strongest predictor of future purchase behavior, as reducing friction is more closely tied to loyalty than increasing delight.
- NPS measures brand sentiment and advocacy but is frequently decoupled from actual customer spending or retention.
- CSAT provides tactical, interaction-level insights but fails to account for the cumulative experience of the customer journey.
- The "Survey Gap" occurs when low response rates (often below 5%) lead to skewed data that misses the middle 90% of the customer base.
- Conversation intelligence fills the data void by analyzing 100% of interactions rather than relying on the small sample of customers who choose to respond to surveys.
The Transactional Pulse: Understanding CSAT
Customer Satisfaction (CSAT) is the most common metric used in contact centers today. Usually delivered via a post-interaction survey on platforms like Zendesk or Salesforce Service Cloud, it asks a simple question: "How satisfied were you with your experience today?"
CSAT is effective for measuring the immediate impact of a specific change, such as a new routing logic or a training initiative. However, it is a poor predictor of retention. A customer may be satisfied with a single call but still choose to leave the brand because the overall product value has diminished or a competitor offers a better price. Furthermore, CSAT is highly susceptible to the "recency effect," where the final moments of an interaction disproportionately influence the score, regardless of the effort required to get there.
The Relational Benchmark: The Role of NPS
Net Promoter Score (NPS) shifted the focus from satisfaction to advocacy. By asking how likely a customer is to recommend a brand to a friend or colleague, NPS attempts to measure the emotional bond between the consumer and the company. Forrester’s CX Index often highlights how high-performing brands use NPS-style sentiment to benchmark themselves against competitors.
While NPS is a favorite of the C-suite for its simplicity, it has significant limitations in predicting churn. Advocacy is an intent, not a behavior. Many "promoters" still churn if they encounter a better offer, and many "detractors" remain customers simply because the cost of switching is too high. This inertia can be mistaken for loyalty, leading brands to ignore underlying service issues.
The Loyalty Driver: Why CES Wins on Retention
The Customer Effort Score (CES) emerged from research now housed within the Gartner Customer Service & Support practice. The core finding was that while "delighting" a customer rarely increases loyalty, "reducing effort" almost always does.
CES asks customers how much effort they personally had to put in to resolve their issue. This metric is a powerful predictor of retention because it directly correlates with the customer's frustration levels. High-effort experiences—such as repeating information, being transferred multiple times, or switching channels—are the primary drivers of disloyalty. Organizations that prioritize CES often find it provides a clearer roadmap for operational improvements than NPS or CSAT ever could.
When the Metrics Lie: The Selection Bias Problem
Every survey-based metric has a fundamental flaw: it relies on the customer’s willingness to participate. In most industries, survey response rates hover between 2% and 5%. This means CX leaders are making multi-million dollar decisions based on a tiny, non-representative sample.
This "Survey Gap" leads to three specific types of data distortion:
- The Polarized Sample: Only the extremely happy and the extremely angry respond. The vast majority of customers—those who are mildly dissatisfied or simply indifferent—are invisible.
- The Politeness Bias: In certain cultures or demographics, customers are hesitant to give low scores even when they are unhappy, leading to artificially inflated CSAT numbers.
- The Silent Churn: Customers who experience high friction but do not have the energy to complain simply stop using the service. These customers never appear in your NPS or CES data; they just disappear from your revenue reports.
Bridging the Gap with Conversation Intelligence
To overcome the limitations of self-reported surveys, leading organizations are moving toward "inferred CX metrics." Instead of asking a customer if they are satisfied, they analyze the actual interaction to determine sentiment, effort, and resolution.
By integrating CCaaS platforms like Five9 or Genesys with a conversation intelligence layer such as Hear.ai (powers our network), teams can achieve 100% coverage of their customer interactions. This approach allows QA teams to identify friction points and compliance risks across every call, not just the small fraction that results in a survey response. For example, if a customer says "I've called three times about this," the system flags high effort immediately, regardless of what the customer might say (or not say) in a follow-up survey.
This shift from reactive surveys to proactive analysis is a key theme in the IDC Future of Customer Experience research, which emphasizes the need for real-time data to drive personalization and retention. When you combine the "what" of a survey score with the "why" of conversation analysis, you get a complete picture of the customer journey.
FAQ
Which metric is best for a small support team?
CSAT is typically the best starting point for small teams because it provides immediate, actionable feedback on individual performance and specific ticket resolutions. It is easier to implement and provides a high volume of tactical data points for coaching.
Can NPS and CES be used together?
Yes, and they should be. NPS provides a high-level view of brand health and competitive positioning, while CES provides a granular view of service efficiency. Using them together allows a brand to see if a great product (high NPS) is being undermined by a difficult support experience (low CES).
How do I improve my survey response rates?
To improve response rates, keep surveys short (under three questions), deliver them in the same channel the customer used for support, and clearly communicate how the feedback will be used. However, remember that even a 10% response rate still leaves 90% of your customer base unmeasured.
Why does my high CSAT not match my high churn rate?
This is often due to the "Single-Interaction Trap." A customer might be happy with the agent they spoke to (high CSAT) but frustrated that they had to call in the first place because the product is unreliable. In this case, CSAT is measuring the agent's empathy, not the brand's reliability.
For more on how to validate your metrics against business outcomes, see our guide on measuring the ROI of CX initiatives or explore how to automate QA with conversation intelligence.