
Why your CX metrics are missing the churn signal
Discover which CX metrics genuinely predict retention. Learn why CSAT, NPS, and CES often provide conflicting data and how to identify when your surveys are lying.
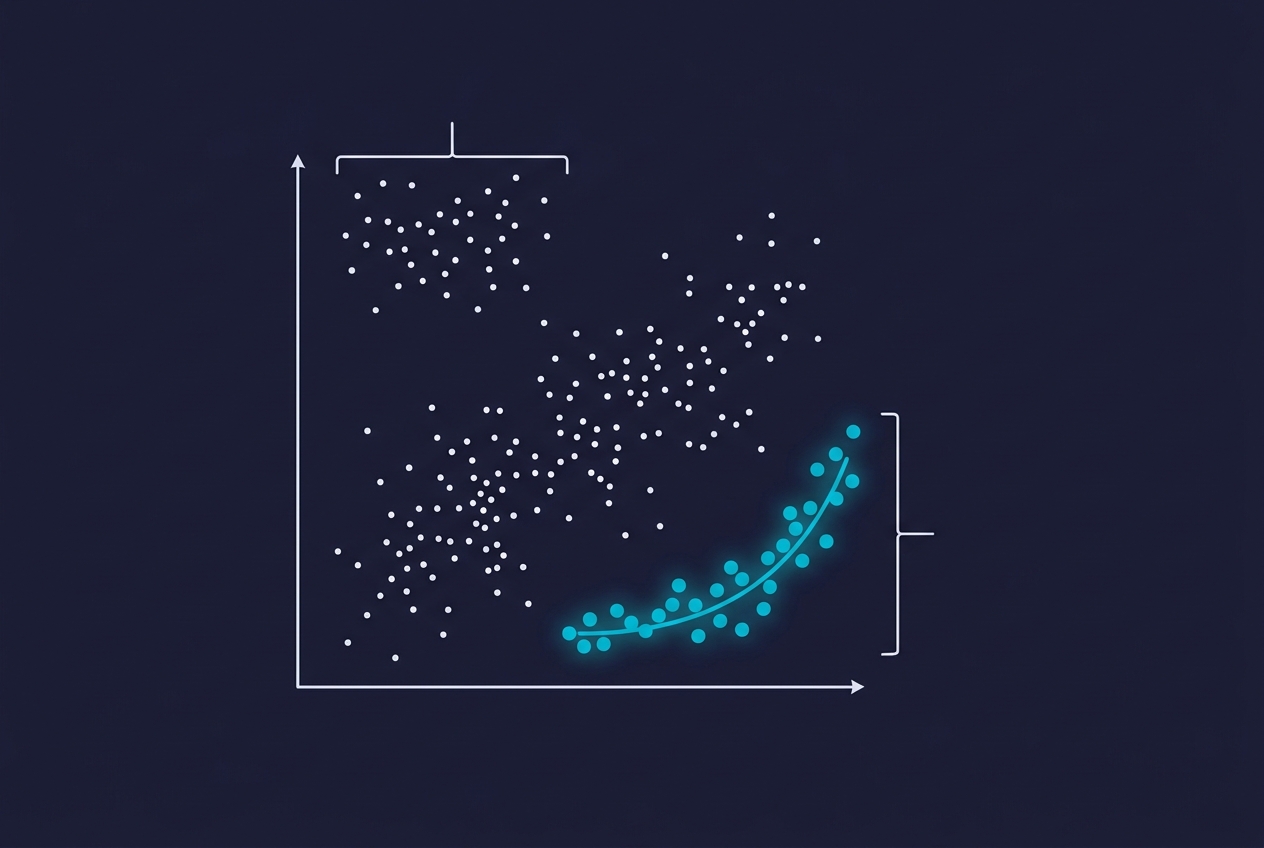
Customer satisfaction (CSAT) measures the success of a moment, Net Promoter Score (NPS) measures the health of a brand, and Customer Effort Score (CES) measures the friction within a process. While organizations often use these metrics interchangeably to forecast loyalty, research suggests they track different behavioral drivers. Customer Effort Score is currently the most reliable predictor of future retention because it identifies the specific friction points that cause customers to switch to competitors.
Key takeaways
- CSAT is a lagging indicator of transactional success but fails to account for the cumulative weight of a poor brand relationship.
- NPS measures sentiment, not behavior, often resulting in "passive" customers who appear satisfied but remain high churn risks.
- CES correlates most strongly with repurchase intent because reducing friction has a greater impact on loyalty than increasing delight.
- Survey bias is systemic, with high scores often masking a "silent majority" of dissatisfied customers who simply stop engaging.
The CSAT Trap: Why happy interactions don't prevent churn
Customer Satisfaction (CSAT) is the most common metric in the contact center, typically gathered through post-interaction surveys on platforms like Zendesk or Salesforce Service Cloud. It is effective for measuring how a specific agent handled a specific ticket. However, CSAT is a poor predictor of long-term retention.
The mechanism behind this failure is the "transactional silo." A customer can have a positive experience with a support agent (high CSAT) while remaining frustrated with the product’s core value or pricing. According to McKinsey, customer journeys are often more important than individual touchpoints. A series of perfect CSAT scores can still lead to churn if the overall journey is fragmented. CSAT "lies" when it is treated as a holistic health score rather than a narrow tactical check.
The NPS Paradox: Advocacy vs. actual behavior
Net Promoter Score (NPS) asks a single question: "How likely are you to recommend this brand?" This metric is designed to measure relational loyalty. While it is a staple of executive dashboards, it often fails to predict individual retention. The gap exists because the intent to recommend is not the same as the intent to stay.
Many "Promoters" (those scoring 9 or 10) may still churn if a competitor offers a lower price or a more convenient interface. Conversely, "Passives" (7 or 8) often provide the most stable revenue despite their lack of vocal advocacy. Forrester’s CX Index frequently highlights that the correlation between high NPS and actual share-of-wallet is not always linear. NPS lies when organizations assume that a lack of detractors equals a high level of retention; in reality, indifference is often a more dangerous churn signal than active dissatisfaction.
The Case for Effort: Why CES predicts retention
Customer Effort Score (CES) asks how easy it was for a customer to resolve their issue. This metric has gained prominence through research popularized by Gartner, which suggests that loyalty is built by meeting basic expectations and reducing work for the customer, rather than by attempting to "wow" them.
The reasoning is grounded in the psychology of friction. Customers are more likely to remember a difficult experience than a pleasant one. When a process—such as a return, a billing change, or a technical fix—requires high effort, the customer’s perceived "switching cost" drops. They begin to look for alternatives that respect their time. Unlike NPS, which is abstract, CES is actionable. If a specific process has a high effort score, leadership knows exactly where to apply resources to improve retention.
When metrics lie: The sampling and bias problem
All survey-based metrics suffer from three primary flaws that can lead to misleading data:
- Selection Bias: Only the very happy and the very angry tend to respond to surveys. The vast middle ground—the customers most likely to churn quietly—is rarely represented in the data.
- Survey Fatigue: As brands increase the frequency of surveys, response rates decline. This leads to a feedback loop where only a tiny fraction of the customer base dictates the strategy for the whole.
- The "Recency" Effect: A customer might give a high score because their most recent call went well, even if they have had four failed interactions in the previous month.
To counter these lies, sophisticated organizations are moving away from relying solely on surveys. Instead, they are integrating conversation intelligence. By using a tool like Hear.ai to analyze every voice and chat interaction, firms can capture the sentiment and effort levels of 100% of their customers, not just the 5% who fill out a form. This provides a more accurate view of compliance and customer frustration that surveys frequently miss.
Building a multi-metric framework
Rather than choosing a single winner, analysts should use these metrics in a layered approach. A robust CX ROI framework uses each metric for its specific strength:
- Use CSAT for agent coaching and identifying immediate friction in the support queue.
- Use NPS for brand-level benchmarking and long-term strategic planning.
- Use CES for process optimization and as the primary early-warning system for churn.
When these metrics are paired with operational data—such as average handle time in Five9 or first-contact resolution rates—the picture becomes clearer. If CES is high but CSAT is also high, it suggests your agents are working hard to overcome broken processes. This is an unsustainable model that leads to both customer churn and agent burnout. For more on managing the human side of this equation, see our guide on agent ramp and retention.
FAQ
Which metric is best for predicting churn? Customer Effort Score (CES) is generally regarded as the best predictor of churn because it measures the friction that directly drives customers to seek competitors. High effort is more closely linked to disloyalty than low satisfaction is.
Why is my NPS high but my retention low? This usually happens because NPS measures brand sentiment rather than the daily reality of the product experience. Customers may like your brand's image but find the actual service or product too difficult or expensive to maintain, leading to "quiet churn."
How can I get more accurate CX data? Supplement your surveys with unsolicited feedback. Use conversation intelligence to analyze call transcripts and chat logs for signs of frustration, as this captures the sentiment of the "silent majority" who do not respond to traditional surveys.
Should I stop using CSAT? No. CSAT remains valuable for measuring the performance of individual agents and specific touchpoints. It should be used as a tactical tool for quality assurance rather than a strategic predictor of business growth.
Measuring customer experience requires looking past the surface-level scores to the behavioral drivers beneath. By focusing on effort and supplementing surveys with direct interaction analysis, leaders can move from reactive reporting to proactive retention management.
Explore our latest research on The ROI of Customer Experience to see how these metrics translate into bottom-line growth.