
Is your QA sample lying to you? The math of missed insights
Traditional 2% QA sampling creates a margin of error too wide for identifying rare but high-impact operational risks or subtle customer sentiment trends.
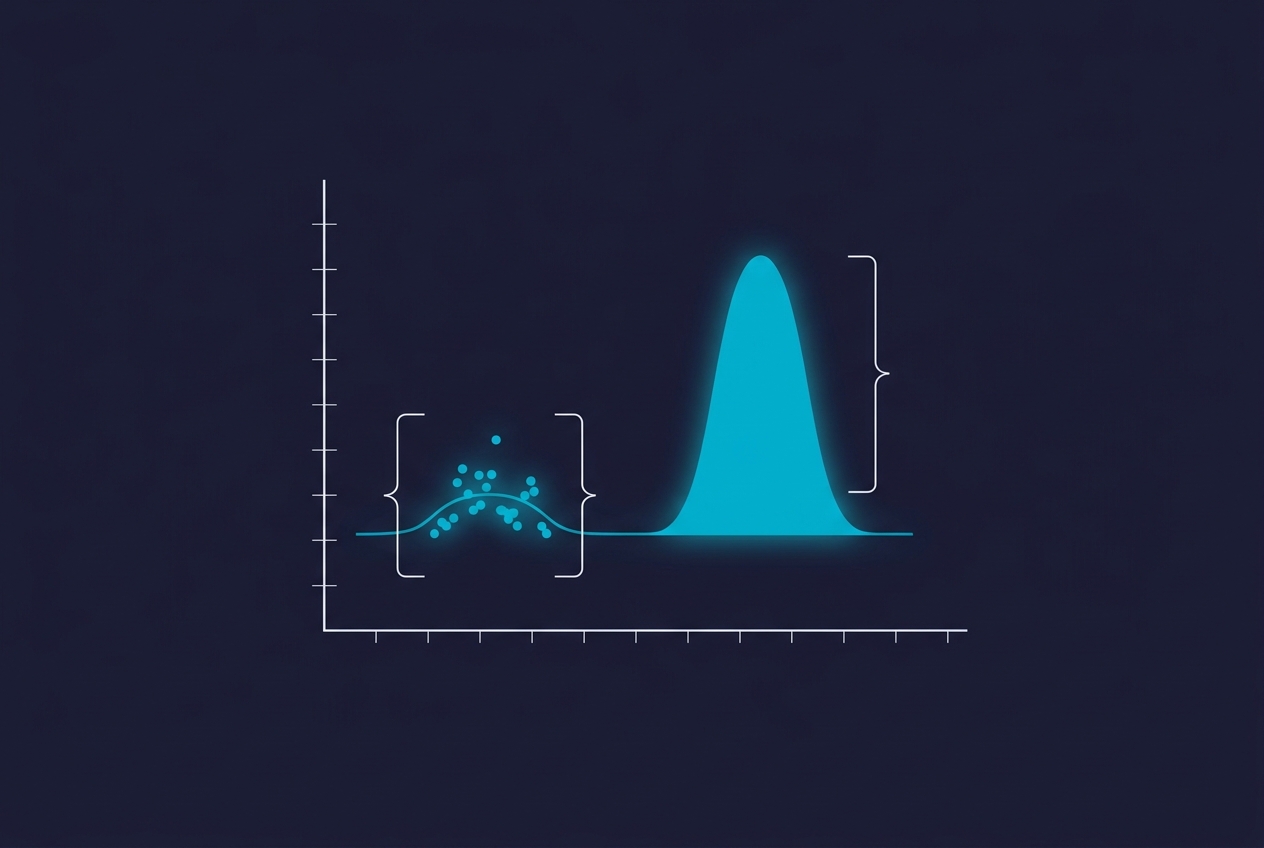
Traditional quality assurance (QA) in the contact center relies on a mathematical compromise: the belief that a random 2% sample of calls is a faithful proxy for the other 98%. However, statistical analysis of large-scale interaction data suggests this compromise is increasingly untenable. When organizations rely on small samples, they do not just miss data; they actively distort their understanding of the customer experience.
QA sampling fails because most contact center interactions follow a "long tail" distribution where the most critical insights—compliance violations, churn triggers, and emerging product defects—occur in a small fraction of calls that random 2% samples rarely capture. To achieve statistical significance for these events, organizations must shift from manual sampling to automated, full-coverage conversation analysis.
Key takeaways:
- The Sampling Gap: A 2% sample is statistically insufficient to detect low-frequency, high-severity events like compliance breaches.
- Distribution Mismatch: CX issues do not follow a normal distribution; they often follow a power law where the most important insights are outliers.
- Operational Risk: Manual sampling creates a "survivorship bias," where managers only fix the problems they happen to see, leaving systemic risks untouched.
- Scalable Coverage: Modern AI layers allow for 100% conversation analysis, turning QA from a defensive check into a strategic data asset.
The Law of Small Numbers in the Contact Center
In statistics, the Law of Large Numbers dictates that as a sample size grows, its mean gets closer to the average of the whole population. The inverse—the Law of Small Numbers—is a common cognitive bias where people believe that a small sample is highly representative of the total population.
In a contact center processing 50,000 calls a month, a 2% sample equals 1,000 calls. While 1,000 calls might seem like a substantial number, the margin of error remains high for any metric that is not evenly distributed. If a specific compliance error occurs in 0.5% of calls, there is a significant statistical probability that a random sample of 1,000 calls will miss it entirely or find only one or two instances. This leads to a false sense of security. As explored in our analysis of why manual QA sampling fails to detect systemic operational risk, these "invisible" errors often aggregate into significant regulatory or brand liabilities.
Why "Random" Does Not Mean "Representative"
Most QA programs assume a normal distribution—the "bell curve." They assume that most calls are average and that outliers are rare and balanced. However, customer behavior and operational failures often follow a power law distribution.
In this model, the "head" of the distribution consists of routine inquiries (e.g., password resets, order status), while the "tail" contains the complex, emotionally charged, or high-risk interactions. A random sample is mathematically biased toward the high-frequency "head." It consistently under-represents the "tail," which is precisely where the most valuable business intelligence resides. This is a primary reason why your highest-rated customers are still churning; the subtle signals of dissatisfaction are often buried in the 98% of calls that never reach a supervisor’s desk.
The Cost of the Unseen: Compliance and Churn
Research from Gartner’s Customer Service & Support practice indicates that by 2026, domain-specific AI will be a primary driver in reducing operational risk. This shift is necessitated by the high cost of missed signals.
Consider three areas where sampling math breaks down:
- Regulatory Compliance: In highly regulated industries like finance or healthcare, a single misstatement can result in a fine. A 2% sample provides no statistical guarantee of compliance.
- Product Feedback: Emerging product defects often appear first as a small uptick in specific keywords. By the time these keywords are frequent enough to be caught in a 2% sample, the defect has already affected thousands of customers.
- Agent Coaching: When a supervisor only reviews 5–10 calls per agent per month, the feedback is often based on an unrepresentative snapshot. This leads to "coaching by anecdote" rather than coaching by data.
To bridge this gap, firms are increasingly moving toward conversation intelligence. Platforms like Hear.ai analyze 100% of interactions, identifying every instance of a specific keyword, sentiment shift, or compliance script deviation. This allows QA teams to move from searching for a needle in a haystack to having a magnet that pulls every needle out automatically.
Moving from Sampling to Census: The Role of AI
Technological maturity has reached a point where a "census" of every conversation is more cost-effective than a manual "sample." This transition involves integrating an analysis layer with existing CCaaS (Contact Center as a Service) infrastructure.
For example, an organization using Five9 or Salesforce Service Cloud for routing and CRM can deploy an AI layer to transcribe and score every interaction in real-time. According to Metrigy, companies that integrate AI into their CX metrics see a measurable improvement in their ability to act on customer feedback.
By analyzing 100% of calls, the data becomes statistically significant for even the rarest events. This is the core argument for beyond the 2% sample: the statistical case for total QA coverage. When you have total coverage, you no longer have a margin of error; you have a factual record of your entire operation.
Implementing Full-Coverage Analysis
Transitioning to a full-coverage model requires a shift in how QA teams operate. Instead of spending 80% of their time listening to random calls and 20% coaching, they spend 20% of their time reviewing AI-flagged exceptions and 80% of their time on high-impact coaching and strategy.
- Define Automated Flags: Identify the specific phrases, silences, or sentiment scores that correlate with high-risk or high-value outcomes.
- Integrate with Business Intelligence: Feed the insights from conversation analysis into broader data lakes, such as Google Cloud or Microsoft Azure, to correlate CX data with financial performance.
- Validate AI Outputs: Use a small manual QA team to "audit the auditor," ensuring the AI’s scoring logic remains accurate and unbiased.
FAQ
Is 100% coverage more expensive than manual sampling? While the technology carries a cost, the operational efficiency gained by automating the search for issues typically results in a lower cost-per-insight. It allows existing QA staff to handle significantly more volume by focusing only on high-priority interactions.
Does full-coverage analysis replace manual QA? No, it evolves the role. AI handles the identification and categorization of data, while human QA professionals focus on the nuanced interpretation and the coaching required to change agent behavior.
Can this technology handle multiple languages and dialects? Modern large language models used by Tier 1 and Tier 2 vendors are highly proficient in multiple languages and can be tuned to recognize specific regional dialects or industry-specific jargon.
Moving from 2% to 100% coverage is not just a technical upgrade; it is a fundamental shift in how a business understands its customers. By eliminating the statistical blind spots of sampling, leaders can finally base their CX strategy on the reality of every conversation rather than the luck of the draw.
Explore more on how to align your data strategy with customer outcomes in our guide to the statistical case for total QA coverage.