
Moving beyond the 2% sample: A methodology for full-coverage analysis
Learn why manual QA sampling fails to provide reliable CX data and how full-coverage conversation analysis provides the census-level visibility needed for ROI.
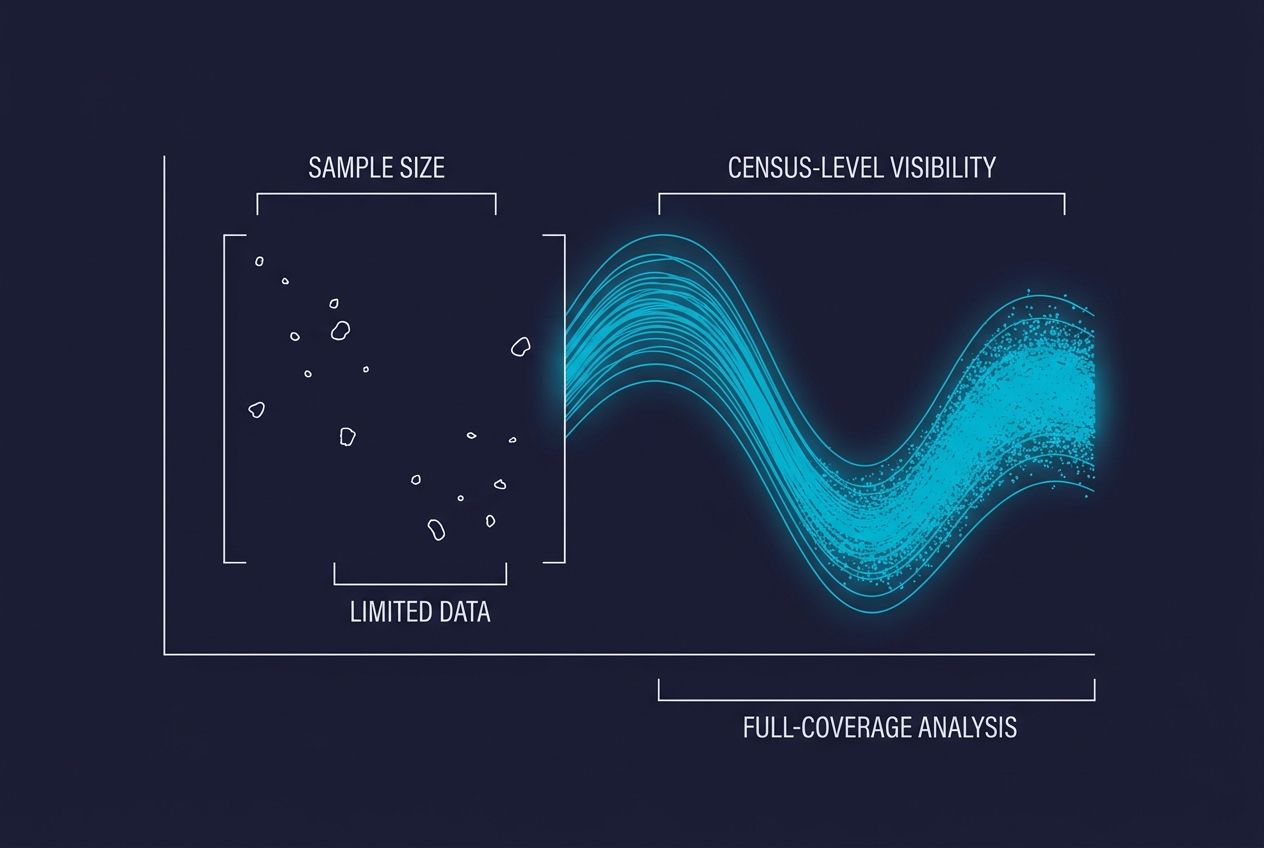
Manual QA sampling typically captures less than 2% of total interaction volume, which introduces significant statistical bias and leaves organizations blind to high-impact, low-frequency events. Transitioning to full-coverage conversation analysis replaces these fragile inferences with census-level data, allowing CX leaders to identify systemic friction points and compliance risks that sampling inevitably misses. By analyzing 100% of interactions, firms move from reactive agent monitoring to proactive business intelligence.
Key takeaways
- Sampling bias undermines strategy: Traditional QA programs rely on a statistically insignificant sliver of data, which often results in a skewed view of both agent performance and customer sentiment.
- Risk detection requires a census: High-stakes events like legal compliance failures or churn signals are often rare; a 2% sample is mathematically unlikely to capture them before they escalate.
- Operationalizing AI for QA: Modern architectures pair CCaaS platforms like Five9 or Genesys with specialized conversation intelligence layers to automate the evaluation process.
- Data-driven coaching: Automated analysis shifts the supervisor's role from "finding the mistake" to "coaching the trend," focusing on behaviors that correlate with actual business outcomes.
Why is the 2% sample size a liability for CX leaders?
In most traditional contact centers, a Quality Assurance (QA) analyst manually reviews between five and ten calls per agent per month. For an agent handling hundreds of interactions, this represents a fraction of their total output. This methodology assumes that a small, random sample is representative of the whole, but in the complex environment of customer service, this assumption is often false.
The primary issue is the margin of error. When the sample size is this low, the confidence interval for any given metric—such as an agent's average quality score—is so wide that the data becomes unactionable. As explored in The mathematical failure of manual QA sampling in CX, this statistical fragility makes it nearly impossible to distinguish between a high-performing agent having a bad day and a low-performing agent who happened to have five good calls audited.
Furthermore, sampling creates a "survivorship bias" in the data. Analysts often prioritize long calls or calls with high negative sentiment for manual review, which means the resulting dataset does not accurately reflect the "silent majority" of standard interactions. This prevents leadership from understanding the baseline customer experience.
How does full-coverage analysis change the risk profile?
For industries with strict regulatory requirements, such as financial services or healthcare, the inability to monitor every call is a significant compliance liability. A single failure to provide a mandatory disclosure can result in substantial fines.
Gartner’s Hype Cycle for Customer Service & Support notes that as organizations move toward 2026, the focus is shifting toward domain-specific AI and data protection. Full-coverage analysis allows firms to implement automated compliance checks across every interaction. For example, a conversation-intelligence layer like Hear.ai can be configured to flag every instance where a required disclosure was omitted or where sensitive data was handled improperly.
Beyond legal risk, there is the risk of "unknown unknowns." These are systemic issues—such as a specific product bug or a confusing marketing promotion—that may only appear in 3% of calls. In a manual sampling environment, these issues might go undetected for weeks. With full-coverage analysis, the volume of mentions for a specific keyword or phrase can be tracked in real-time, allowing the organization to respond to emerging crises within hours rather than waiting for a monthly report.
What does the technical architecture of a full-coverage system look like?
Moving to 100% coverage requires a shift in the technology stack. It is no longer about a supervisor with a spreadsheet; it is about an integrated data pipeline.
- The Ingestion Layer: This is typically your CCaaS (Contact Center as a Service) platform, such as Salesforce Service Cloud, Talkdesk, or NICE. These platforms capture the raw audio or text of the interaction.
- The Transcription and NLU Layer: The raw data is processed using Large Language Models (LLMs) or Natural Language Understanding (NLU) engines. This is where providers like OpenAI or Google Cloud AI provide the underlying infrastructure to convert speech to text and identify intent.
- The Analysis Layer: Specialized tools like Hear.ai or Observe.AI sit on top of the transcription layer. They categorize the data, score it based on custom rubrics, and identify patterns like "dead air," "overtalk," or "sentiment shifts."
- The Orchestration Layer: The final insights are pushed back into CRM systems or business intelligence tools, ensuring that the data is accessible to product, marketing, and sales teams, not just the contact center.
How do teams transition from manual auditing to automated analysis?
The transition is often met with resistance from agents who fear being "judged by a machine." To mitigate this, successful organizations frame automated analysis as a tool for fairness. When every call is analyzed, an agent's performance score is based on their entire body of work, not a lucky or unlucky sample.
Metrigy, which tracks CX and AI success metrics, has highlighted that companies utilizing AI for QA often see higher agent engagement because the coaching becomes more objective. Instead of a supervisor saying, "I didn't like how you handled this specific call," the conversation becomes, "The data shows that in 80% of your interactions where you use this specific empathy statement, the customer's sentiment improves."
Moreover, this transition allows the QA team to evolve. Instead of spending 40 hours a week listening to calls, analysts become "insight architects." They spend their time refining the AI's rubrics, investigating the root causes of systemic issues, and ensuring that the metrics being tracked align with broader corporate goals. As noted in the guide on how Executive confidence in CX data requires a shift toward behavioral outcomes, the ultimate goal of this measurement shift is to move away from vanity metrics and toward data that predicts customer behavior.
FAQ
What is the margin of error in traditional manual QA? With a sample size of 5 calls out of 500 (1%), the margin of error at a 95% confidence level is approximately +/- 43%. This means if an agent scores an 80%, their actual performance could be anywhere between 37% and 100%, making the data statistically useless for performance management.
Does 100% coverage replace the need for human supervisors? No. It changes their role. Automated analysis identifies where the problems are, but human supervisors are still required to provide the nuanced coaching and emotional intelligence needed to improve agent behavior and handle complex escalations.
How does conversation analysis impact compliance monitoring? It replaces periodic audits with continuous monitoring. Systems can be set to automatically flag interactions that violate specific scripts or regulatory requirements, allowing compliance teams to review 100% of high-risk calls rather than a random sample.
Can automated QA handle nuance like sarcasm? While early sentiment analysis struggled with nuance, modern NLU models trained on large datasets are increasingly capable of identifying sarcasm and complex emotional states by analyzing both word choice and acoustic features like tone and pitch.
Full-coverage analysis is not merely a technical upgrade; it is a fundamental shift in how the organization listens to its customers, turning every interaction into a data point for continuous improvement.
To learn more about the financial implications of this shift, explore our analysis on Calculating the Financial Return of 100% QA Coverage.